
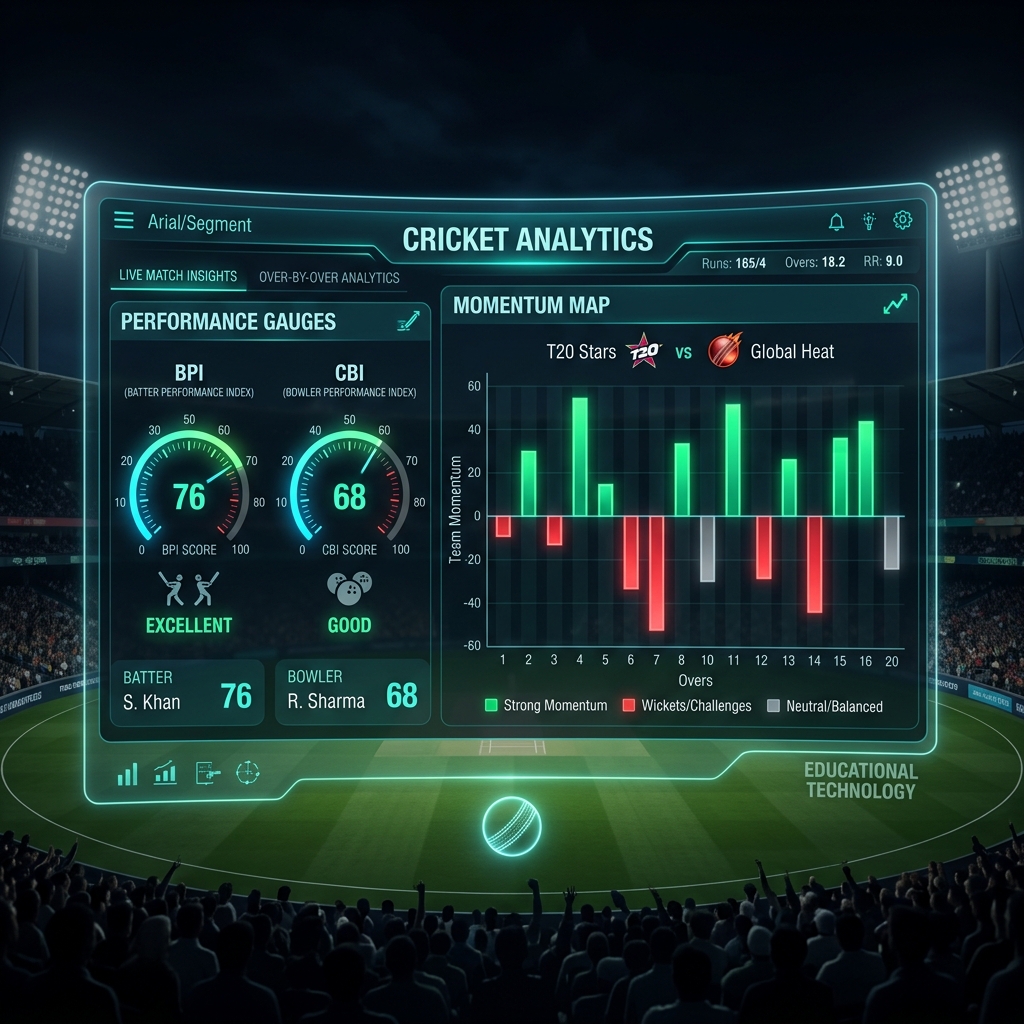
Cricket has always been a statistics-rich sport. But traditional stats — batting average, bowling economy, strike rate — only tell part of the story. CricRover was built to tell the rest. If you're new to advanced cricket analytics, this guide will walk you through our three core metrics in plain language, using real match examples to bring the numbers to life.
Why Traditional Stats Are Not Enough
Imagine two T20 innings: Batsman A scores 60 off 40 balls (strike rate: 150) while Batsman B scores 40 off 20 balls (strike rate: 200). Traditional stats say Batsman A scored more runs. But what if Batsman A batted in the easy middle overs of a low-pressure chase, while Batsman B smashed those 40 runs in the final 3 overs when his team needed 60? Context changes everything — and that's the core philosophy behind CricRover's metrics.
Understanding the Momentum Map
- Bright Green = Batting Dominance: The batting team scored 10+ runs in that over. Boundaries, easy singles, the bowlers are under pressure.
- Yellow/Orange = Contested Over: 5-9 runs scored. Neither team dominated — a balanced, competitive over.
- Dark Grey = Bowling Control: 0-4 runs scored. The bowlers choked the run rate. This is called "building pressure."
- Red = Wicket Over: A wicket fell in this over. Regardless of runs scored, a wicket shifts momentum dramatically.
By reading the Momentum Map left to right, you can instantly see the story of the innings: where it accelerated, where it stalled, and where the match turned. No complicated numbers required — just colours.
Understanding the Bowling Pressure Index (BPI)
BPI answers one question: how much pressure did this bowler actually create? It's scored on a 0-100 scale. Think of it like a school grade — 75+ is excellent, 50-75 is good, below 35 is poor. What makes BPI different from economy rate? BPI accounts for the situation. A 10-run over bowled against the world's best batsman with the opposition needing 15 an over may be entirely reasonable — BPI gives a balanced score by weighting the difficulty of the situation.
"BPI is what every cricket fan already does intuitively — judging bowling based on the situation — but made mathematically precise."
Understanding the Contextual Batting Index (CBI)
CBI does for batting what BPI does for bowling — it adjusts performance for context. A CBI score of 100 means the batsman performed exactly as expected for their situation. Above 100 means they outperformed expectations; below 100 means they underperformed. If a batsman needs to score at 10 runs per over and they're smashing it at 14 per over, their CBI climbs above 140. If they're only managing 7 per over when 10 is required, their CBI falls below 70.
Getting Started on CricRover
Click on any live or completed match on CricRover's homepage to access the full analytics dashboard. The Momentum Map loads instantly for every match, BPI scores are displayed in the bowling section, and CBI ratings appear next to each batsman's scorecard entry. No registration required — all analytics are completely free. Start with a match you watched recently and see if the Momentum Map matches your memory of how the game unfolded. We think you'll be surprised by what the data reveals.