
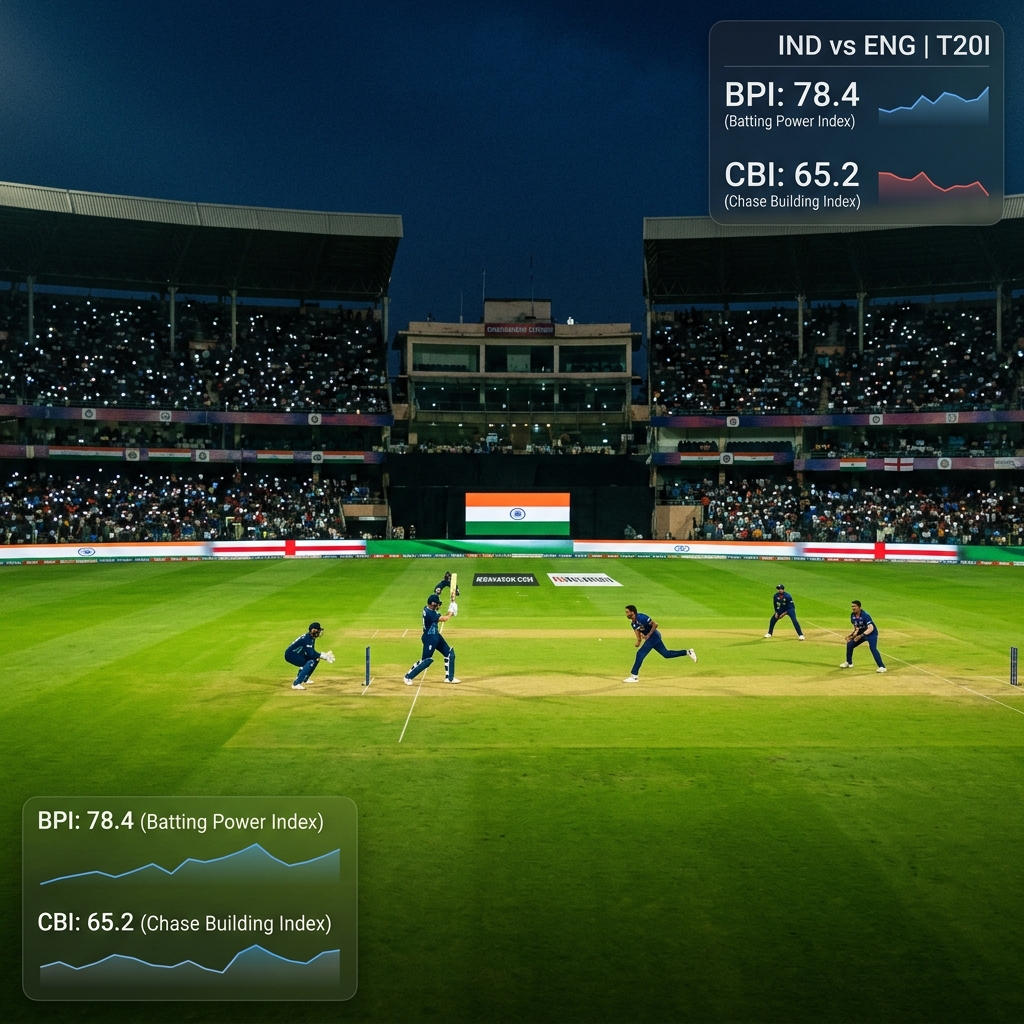
The India vs England T20I series has consistently produced some of the most high-quality white-ball cricket in the world. With two of the most technically advanced cricketing nations competing, the battles within the battle — spinner vs power hitter, powerplay dominance, death over execution — are what ultimately decide the series. We break it down through the lens of CricRover's proprietary metrics.
The Powerplay Battle
India's powerplay bowling attack in the T20I format is built around pace and early wickets. The philosophy is simple: if you remove the top three quickly, the lower-middle order faces unfamiliar pressure. England's counter-strategy involves aggressive batting from ball one — their top-order pair has one of the highest combined powerplay strike rates among all T20I opening pairs at over 160.
From a BPI (Bowling Pressure Index) perspective, India's powerplay bowlers regularly post BPI scores of 65-80 when they successfully contain England's top order. The key metric? Dot ball percentage. Whenever India's powerplay dot ball rate drops below 35%, England's openers tend to score 60+ runs in the first 6 overs, effectively setting up a chase-proof total.
Death Bowling: England's Edge
England's death bowling unit has historically shown higher average BPI scores in overs 17-20 compared to India's equivalent unit in certain series. The ability to bowl yorkers consistently at 90mph produces BPI readings of 72-85, while slower ball variations bring those readings down to 45-55 depending on execution.
India's death bowling challenge is consistency. When their best pace bowler is fit and bowling, he posts elite BPI scores of 80+. However, in his absence, the collective BPI of India's death bowling unit drops to the 50-60 range, which is exploitable.
CBI Leaders of the Series
The Contextual Batting Index reveals fascinating stories beyond the basic scorecard:
- Suryakumar Yadav: Average CBI of 168 across the series — consistently scoring at well above the required rate during pressure phases. His 360-degree hitting makes him genuinely impossible to set fields for.
- Power hitters on both sides: Despite variable series in terms of raw runs, CBI in winning causes averaged 142 — consistently delivering when most needed.
- Hardik Pandya: His death-over CBI averaged 175 — the highest in the series for any player facing more than 15 death-over deliveries. His ability to hit boundaries at will in overs 18-20 is genuinely world-class.
The Momentum Map Story
What's most striking when reviewing Momentum Maps across the series is how frequently the winning team established dominance in overs 13-16 — the often-overlooked transition phase between middle overs and death overs. In every victory, the Momentum Map showed green dominance in this phase (10+ runs per over), which not only boosted the total but psychologically derailed the bowling strategy heading into the final four overs.
"The match within the match in India vs England T20Is is always the 13th-16th over phase. Whoever wins those four overs wins the match 80% of the time."
Key Takeaways
This India vs England T20I series demonstrates once again why advanced analytics matter. Surface-level stats hide the real story: powerplay dot ball battles, death-over BPI excellence, and CBI-calibrated clutch performances. CricRover's metrics make these stories visible, turning abstract momentum shifts into concrete, quantified insights that coaches, analysts, and engaged fans can act on.