
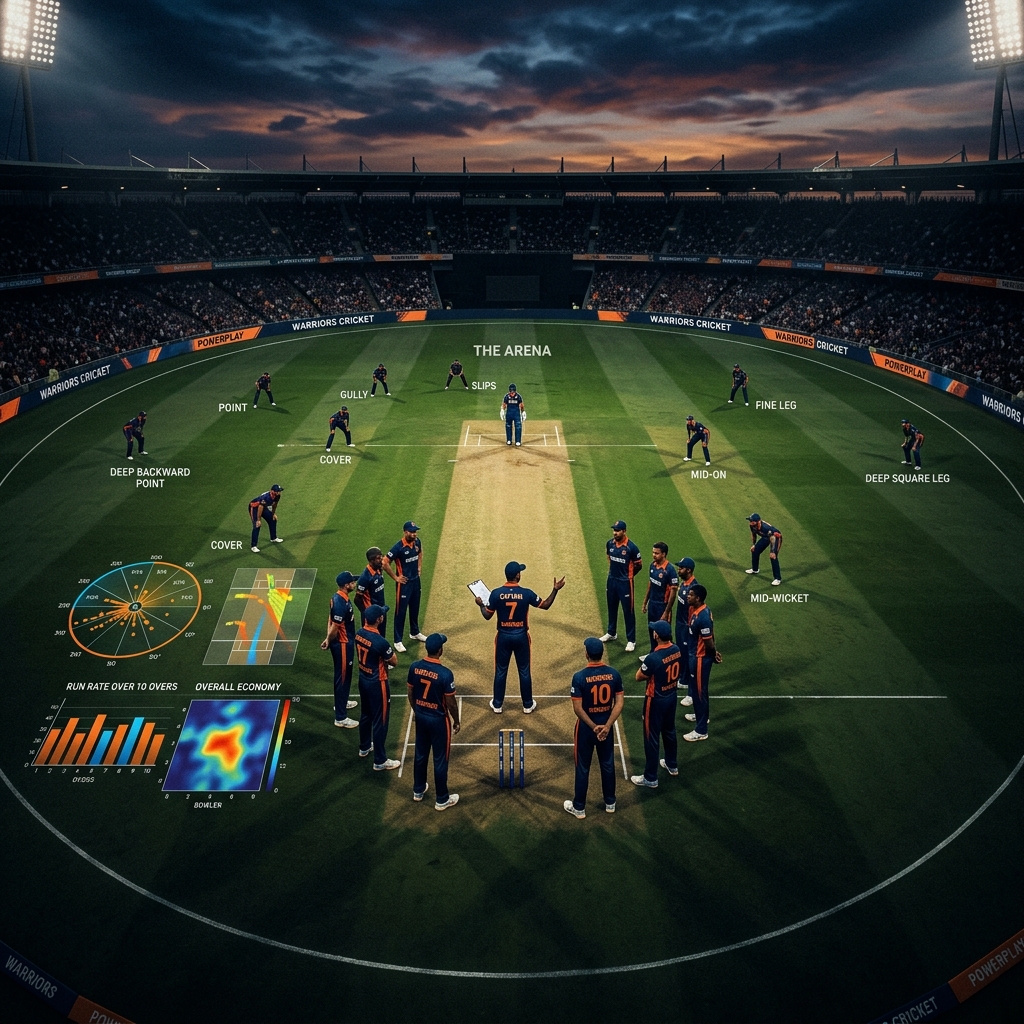
Rohit Sharma's captaincy tenure represents one of the most analytically interesting periods in Indian cricket history. His approach — aggressive top-order batting, flexible middle-order utilisation, and a clear preference for pressure-building bowling spells over wicket-to-wicket attacking bowling — has fundamentally changed how India approach 50-over cricket.
The Batting Order Revolution
Under Rohit's captaincy, India's batting order flexibility reached unprecedented levels. The "horses for courses" approach — sending players based on matchup data rather than fixed positions — is reflected in improved CBI scores. India's collective batting CBI in Powerplay overs improved significantly, driven by the intent to play aggressive cricket from ball one.
The philosophy: if the top order plays at 170+ strike rate in the powerplay, the middle order faces less pressure in the middle overs, allowing them to bat at 100-110 strike rate while consolidating. This sequencing produces higher total scores than trying to maintain 140+ strike rate throughout all 50 overs.
Bowling Rotation: The BPI Strategy
Rohit's bowling rotations show a clear preference for bowlers with consistently high BPI in specific phases. He has shown willingness to hold back pace bowlers during middle overs in favour of spinners who generate higher BPI in that phase. This data-driven instinct aligns perfectly with what BPI analysis recommends.
Momentum Map Signature
India's Momentum Maps under this captaincy show a distinctive double-peak pattern: high green bars in overs 1-6 (powerplay aggression) and again in overs 41-50 (death-over acceleration), with more measured middle-over contributions. This contrasts with a more uniform, linear Momentum Map profile from earlier eras — suggesting a more strategic, phase-specific approach to match building.
The Numbers Don't Lie
India's average first-innings total has increased, their average bowling economy in death overs has improved, and their chase success rate has climbed. These macro numbers are directly reflected in the micro-level BPI and CBI improvements visible in CricRover's match data — a compelling case study in how tactical intelligence translates to measurable performance improvement.